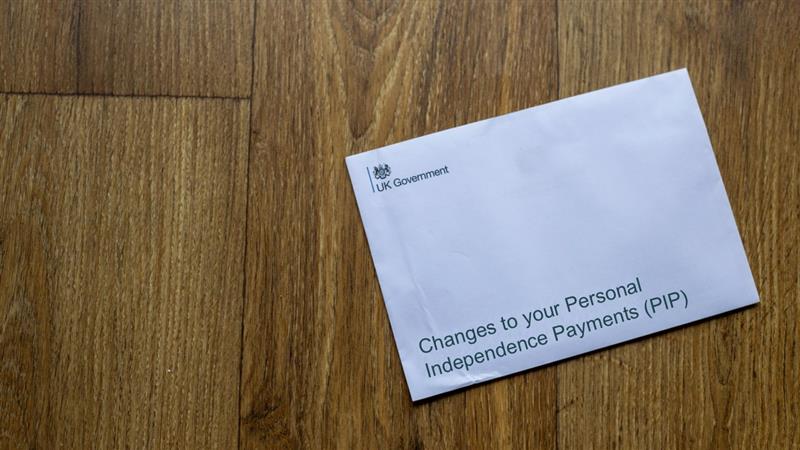
Our new research published today exposes critical gaps in the safety net if the government’s proposed changes to Personal Independence Payments (PIP) go ahead, focussing on the important role disability charities play across England and Wales.
‘Double whammy impact on the poorest’
The government’s proposed cuts to disability benefits will impact some of the most deprived areas, with the least available capacity of disability charities.
This is the key finding from our new analysis, bringing together data on where disabled people, and specifically PIP claimants live, and combining that with the locations and capacity of disability charities across England and Wales.
The research exposed a serious gap in the safety net for those at risk of losing PIP, revealing that cuts to PIP will impact some of the most deprived areas of the UK with the most limited capacity among disability charities, creating a ‘double whammy’ impact on the poorest.
The areas most at risk
Of the twenty local authority areas with the weakest available support, more than half are among the top 10% most deprived areas of the UK. This includes Blackpool and Knowsley, the first and third most deprived areas in England, as well as Caerphilly and Bridgend, two of the most deprived areas in Wales.
These areas have high numbers of PIP claimants at risk of losing support, yet some of the most limited capacity among charities that support disabled people – which could create a dangerous combination of increased need and low support.
The top 20 Local Authority areas with the least capacity to support are: Barnsley, Caerphilly, Bolsover, Broxtowe, Knowsley, Telford and Wrekin, South Tyneside, Redcar and Cleveland, Great Yarmouth, Neath Port Talbot, Thanet, Walsall, Wyre, Tameside, Blackpool, Oldham, Bridgend, Newcastle-under-Lyme, Hartlepool and Mansfield.
To explore all the data for Local Authority areas across England & Wales, visit our new interactive dashboard.
Regional divide
The data also points to a regional gap. The North East, and North West have over 8 in 10 of their local authorities with some of the least disability charity capacity, whilst those in London and the South East have some of the greatest capacity. Over 8 in 10 in the North East are in the lowest 40% of capacity, whilst 8 in 10 in Yorkshire and the Humber. For Comparison, no London Local Authority is in the lowest area of capacity, with more than three quarters of London having some of the highest levels of disability charity capacity.
Government yet to recognise both the risk and opportunity
The government’s impact assessment, published on 18 June, looked at proposed cuts to both Universal Credit and PIP, yet there was no recognition of the impact rising demand could have on the charity sector. This is despite the fact that local charities provide vital services and support to people with disabilities.
These same organisations could also play a key role in helping people into work, which the government has stated is a key aim of the proposed changes. Yet this crucial partnership has also been left unexplored.
We think that if the government are serious about helping disabled people into work, then the third sector must be supported to thrive, which would require the government to:
a) recognise the risk of limited disability charity capacity to meet increased demand, and
b) take steps to support disability organisations, particularly those in the poorest areas with least existing capacity, so that they can meet rising demand and support people into work.
How we developed the research
We used a data-driven approach to estimate the capacity of the disability charity sector across England and Wales. Rather than evaluating individual charities, we assessed the sector as a whole, at the local authority level, using publicly available data to construct proxy measures of demand and supply to estimate a measure of comparative capacity.
Data Sources and Scope
- Charity Commission Register: Filtered for charities with a stated focus on disability
- The dataset was reduced from 52,466 to 36,591 charities after excluding records with missing data, insolvency, or income and expenditure below £1,000.
- Personal Independence Payment (PIP) Claimants (House of Commons Library, February 2024): Used as a proxy for individuals with recognised disability-related need.
- 2021 Census Data (Office for National Statistics): Provided self-reported disability data for adults aged 16 to 65.
- All raw data is presented in our Tableau dashboard to allow full exploration of the data.
- Geographic integration was performed using NSPL boundary files, adjusted to account for 2023 local authority mergers.
Key Ratios
- Disabled people per charity – lower values suggest higher coverage or availability of support comparatively
- Charity expenditure per PIP claimant – higher values suggest more financial resource per individual potentially in need, it is a comparative measure and a proxy for capacity which suggests better resources charities in some areas of the country.
Each local authority was ranked on these two metrics. These ranks were then averaged to create a composite index, allowing comparisons across regions.


